Taurus Nifty50 Index Fund
Inception Date
01 Jan 2013
NAV
21.78 as on 06 Apr 2021
Who should invest?
- Investors who are looking to a long term, medium risk strategy to benefit from economic growth of India
- Ideal for first time equity investors who do not have the time or expertise to evaluate individual stocks or track the actively managed funds
- For the experienced investors or HNIs it can act as a balancing strategy for their portfolios. Investing in Nifty50 Index Fund gives them exposure to the leading 50 stocks at one go.
Fund Performance
Return(%) - As on 31st July 2025
| NAV Details (Growth Option) |
|
|
|
||||||
|---|---|---|---|---|---|---|---|---|---|
| 1 Year |
|
|
|
||||||
| 3 Year |
|
|
|
||||||
| 5 Year |
|
|
|
||||||
| Since Inception |
|
|
|
||||||
Fund’s Portfolio Analysis
Riskometer
Riskometer Scheme#
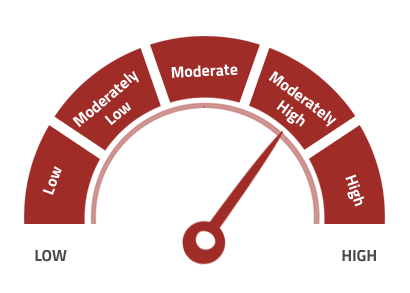
Investors understand that their principal will be
at moderately high risk
Riskometer Scheme Indices
* Investors should consult their financial advisers if in doubt about whether the product is suitable for them.
Fund Details
 Common Application Form
Inception Date
10 Jun 2010
NAV
20.76 as on 06 Apr 2021
Who should invest?
- Investors who are looking to a long term, medium risk strategy to benefit from economic growth of India
- Ideal for first time equity investors who do not have the time or expertise to evaluate individual stocks or track the actively managed funds
- For the experienced investors or HNIs it can act as a balancing strategy for their portfolios. Investing in Nifty50 Index Fund gives them exposure to the leading 50 stocks at one go.
Fund Performance
Return(%) - As on 31st July 2025
| NAV Details (Growth Option) |
|
|
|
||||||
|---|---|---|---|---|---|---|---|---|---|
| 1 Year |
|
|
|
||||||
| 3 Year |
|
|
|
||||||
| 5 Year |
|
|
|
||||||
| Since Inception |
|
|
|
||||||
Fund’s Portfolio Analysis


Riskometer
Riskometer Scheme#
Investors understand that their principal will be
at moderately high risk
Riskometer Scheme Indices
* Investors should consult their financial advisers if in doubt about whether the product is suitable for them.